


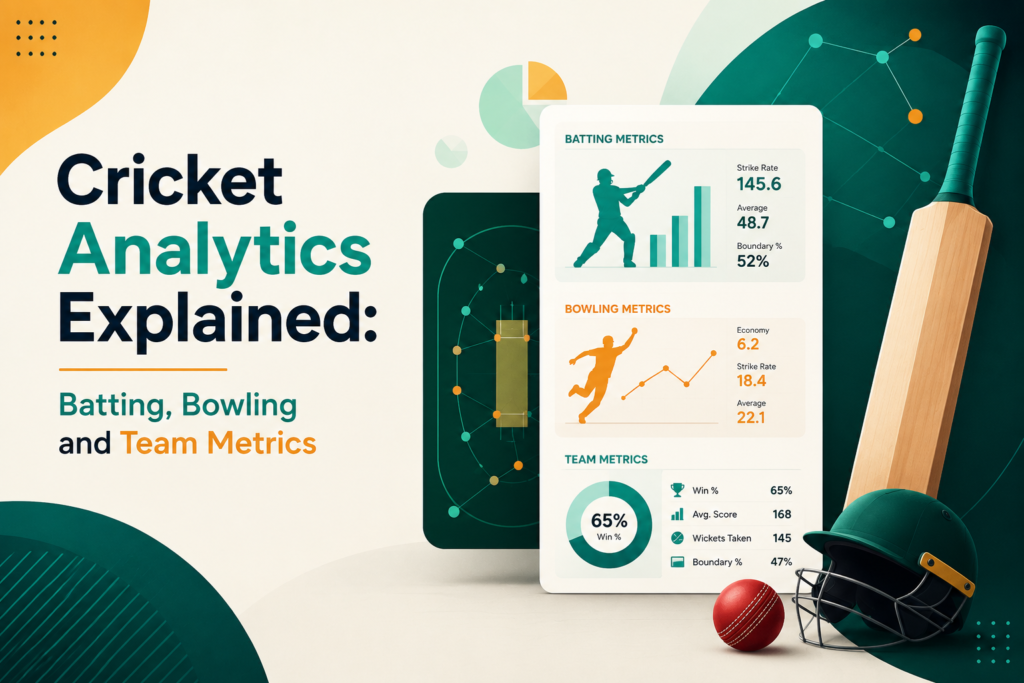
Cricket looks simple on the scoreboard, but the numbers behind a match can tell a much bigger story. Runs, balls faced, strike rate, economy rate, partnerships, and required run rate all add context to what is happening on the field. Platforms like Tigerexch can also make these match details easier for cricket enthusiasts to follow and understand.
This guide explains the most useful cricket metrics in simple terms. The goal is to help readers understand performance data and live-match context rather than treat statistics as guaranteed predictions
What Is Cricket Analytics?
Cricket analytics is the use of statistical information to understand player and team performance. Common data points include:
Runs scored
Balls faced
Strike rate
Batting average
Boundaries
Wickets
Bowling average
Economy rate
Overs bowled
Dot-ball percentage
Partnerships
Run rate
Required run rate
Wickets remaining
These figures become more useful when they are viewed together. For example, a batter scoring 50 runs from 35 balls has a different impact from a batter scoring 50 from 60 balls. Similarly, two bowlers can take the same number of wickets while conceding very different numbers of runs.
The statistic matters, but the match situation around it matters just as much.
Understanding Cricket Metrics in a Real Match
The easiest way to read cricket analytics is to connect the numbers to the stage of the match. In a T20 chase, for example, the current score alone is not enough. You also need to consider overs remaining, wickets in hand, current scoring rate and the required run rate.
A team needing 60 runs from 30 balls with eight wickets in hand is in a different position from a team needing the same 60 runs with only two wickets left. The target has not changed, but the resources available to reach it have.
This is why good cricket analysis combines several relevant statistics instead of relying on one number.
Batting Metrics Every Cricket Fan Should Understand
Runs and Balls Faced
Runs are the basic measure of batting output, while balls faced show how much time a batter has spent at the crease.
Consider two hypothetical innings:
| Batter | Runs | Balls | Strike Rate |
| Player A | 60 | 40 | 150.00 |
| Player B | 60 | 60 | 100.00 |
Both players scored 60 runs, but their scoring speed was different. The first innings may have created more pressure in a limited-overs match, while the second may have placed more emphasis on occupying the crease. Neither performance should be judged without considering the format and match situation.
Strike Rate
Strike rate measures how quickly a batter scores.
Formula: Strike Rate = (Runs ÷ Balls Faced) × 100
A strike rate of 125 means the batter scored at a rate of 125 runs per 100 balls.
Strike rate is particularly useful in limited-overs cricket, but it should be considered alongside wickets remaining, overs remaining, pitch conditions, required run rate, match format and bowling quality.
A high strike rate is not automatically better if it comes with frequent dismissals.
Batting Average
Batting average provides another view of consistency.
Formula: Batting Average = Runs Scored ÷ Times Dismissed
Average and strike rate measure different aspects of batting. Average provides context around scoring output and dismissals, while strike rate describes scoring speed. Using both gives a more complete picture.
Boundary Percentage
Boundary data can show how a batter is generating runs. One player may score heavily through fours and sixes, while another may rely more on running between the wickets. This can help explain why similar totals were reached in different ways.
During a live innings, a sudden increase in boundaries can also indicate a change in batting approach or bowling conditions.
Partnerships
A partnership is the combined contribution of two batters before one of them is dismissed. Partnership figures can show whether an innings is rebuilding after wickets or accelerating toward a strong total.
A short partnership can help stop early pressure from becoming a collapse.
A substantial middle-order partnership can rebuild an innings.
A late partnership can significantly change a team’s final total.
Partnerships matter because cricket is a team sport. Individual scores are important, but the way batters combine can have an even bigger effect on the innings.
Bowling Metrics That Matter
Wickets
Wickets are among the most visible bowling statistics, but wicket counts alone do not describe a spell. A bowler taking three wickets for 20 runs has produced a different spell from one taking three wickets for 60 runs.
Wickets should therefore be considered alongside runs conceded, overs, economy rate and match conditions.
Economy Rate
Economy rate measures the average number of runs a bowler concedes per over.
Formula: Economy Rate = Runs Conceded ÷ Overs Bowled
If a bowler concedes 24 runs in six overs, the economy rate is 4.00 runs per over.
Economy rate is useful for assessing scoring pressure. A bowler can influence an innings by limiting runs even without taking frequent wickets.
Bowling Average
Bowling average generally measures the runs conceded for each wicket taken.
Formula: Bowling Average = Runs Conceded ÷ Wickets Taken
If a bowler concedes 100 runs and takes five wickets, the bowling average is 20.
A lower bowling average generally indicates fewer runs conceded per wicket, although the interpretation depends on the format and sample size.
Dot Balls
A dot ball produces no run from the delivery. A sequence of dot balls can increase pressure by reducing scoring opportunities, especially when the required run rate is rising.
Dot-ball percentage can therefore add useful context alongside economy rate and wickets.
Team Metrics: The Bigger Picture
Run Rate
Run rate measures scoring speed.
Formula: Run Rate = Runs Scored ÷ Overs Faced
If a team scores 120 runs in 15 overs, its run rate is 8.00 runs per over.
Run rate becomes particularly useful when comparing current scoring pace with a target or the requirements of a chase.
Required Run Rate
During a chase, required run rate shows how quickly the batting side needs to score to reach its target within the remaining overs.
Formula: Required Run Rate = Runs Required ÷ Overs Remaining
If a team needs 80 runs from 10 overs, the required rate is 8.00 runs per over. The figure changes as runs are scored and wickets fall.
Wickets in Hand
Runs are only one part of a chase. A team with more wickets remaining has more batting resources available, while a team that has lost several wickets may have less freedom to attack.
A useful way to think about a chase is to consider the score, wickets and overs together.
Reading Batting and Bowling Metrics Together
The biggest mistake when reading cricket analytics is treating statistics independently. Imagine a chasing team needs 90 runs from 60 balls. That requirement may look manageable, but the situation changes if the team has already lost seven wickets.
The same principle applies to bowling. A strong economy rate can look impressive, but the remaining bowling options and match stage still matter.
Current score
Overs remaining
Wickets remaining
Recent scoring rate
Required run rate
Current batters
Available bowlers
Partnerships
Recent wickets
No single number provides the complete picture.
How Match Momentum Appears in Statistics
Momentum is often discussed in simple terms, but changes in the numbers can help explain why the match has shifted.
Several consecutive boundaries
A long partnership
A spell of low-scoring overs
A cluster of wickets
A sharp change in required run rate
Increased dot-ball pressure
A change in bowling options
For example, a chasing side moving from 45/3 to 100/3 may have gained control through a strong partnership. The numbers still need context, including the target, innings stage, pitch and remaining bowling attack.
Using Cricket Analytics Around Exchange Markets
Readers who follow cricket exchange markets may see statistical information alongside live market activity. These are related but different things: analytics describe the match, while an exchange market reflects market activity and participant expectations.
A market can move after a wicket, boundary, bowling change, change in required rate or other new information. Understanding the underlying cricket data can make those changes easier to interpret, but statistics do not guarantee what happens next.
The same principle applies when using a cricket exchange app: check what each displayed number represents, whether it is current, and how it relates to the wider match situation.
Common Mistakes When Reading Cricket Statistics
Looking at Runs Alone
A 70-run innings does not show how efficiently those runs were scored or the conditions in which they were made. Consider balls faced, strike rate and match situation.
Treating Strike Rate as Everything
Fast scoring can be valuable, but losing wickets quickly can weaken an innings. Strike rate needs context.
Ignoring Bowling Economy
Wickets attract attention, but economical bowling can create pressure without immediate wickets.
Comparing Different Formats Directly
Test cricket, one-day cricket and T20 cricket have different scoring patterns and strategic demands. Metrics should be interpreted within the relevant format.
Ignoring Sample Size
A statistic based on a small number of matches may not represent a player’s long-term ability. Larger samples usually provide more useful context.
Forgetting Match Conditions
Pitch behavior, weather, boundaries, dew and venue characteristics can influence performance. Statistics should be read alongside conditions.
A Simple Framework for Reading Live Cricket Data
Step 1: Check the Score
Look at runs, wickets and overs.
Step 2: Check the Scoring Rate
Compare the current run rate with the required rate where relevant.
Step 3: Examine the Batters
Look at runs, balls faced, strike rate and the current partnership.
Step 4: Examine the Bowlers
Check wickets, runs conceded, economy rate and recent pressure.
Step 5: Consider the Match Context
Consider wickets, remaining overs, available bowlers and batting resources before drawing conclusions.
This process gives a more balanced view than reacting to one statistic.
Where the Tiger Exchange App Fits
The Tiger Exchange app may be relevant to readers following cricket-related information through a mobile interface, but the underlying principles of cricket analysis remain the same.
Before relying on any displayed statistic, check what the number represents and whether it is current. A scorecard, live data feed and market display may present different types of information.
What the statistic measures
How it is calculated
Why it matters
What its limitations are
How it relates to other statistics
Responsible Use of Cricket Analytics
Statistics are useful tools for understanding cricket, not guarantees of future results. A match can change quickly because of a wicket, partnership, bowling spell, weather or individual performance.
Anyone participating in exchange or betting activities should understand the financial risks involved, use only money they can afford to lose, and check applicable local laws and platform rules before participating.
Analytics should support informed understanding of the sport rather than encourage impulsive decisions.
Key Takeaways
Cricket analytics turns scorecard data into useful performance context.
Strike rate describes batting speed, while batting average provides a different view of consistency.
Economy rate helps show how effectively a bowler controls scoring.
Run rate and required run rate help explain scoring pressure.
Wickets in hand can change the meaning of a target.
Partnerships can reveal how an innings is developing.
No single statistic explains an entire cricket match.
Exchange-market information should be interpreted separately from cricket performance data.
Statistics can improve understanding but cannot guarantee a match outcome.
Conclusion
Cricket analytics is most useful when batting, bowling and team metrics are considered together. Strike rate, economy rate, partnerships, run rate, required run rate and wickets in hand each answer a different question about the match.
For readers exploring Tiger exchange app or cricket exchange markets, understanding the sport and its statistics should come before interpreting market movement. A balanced approach looks at several relevant numbers, considers match conditions and recognises the limits of statistical information.
The value of cricket analytics is not in promising a result. It is in making match information easier to understand as the game develops.
FAQs
What is cricket analytics?
Cricket analytics is the use of statistical data to evaluate player and team performance, including batting, bowling, scoring rates, partnerships, wickets and match context.
What is the most important batting statistic?
There is no single statistic that works for every situation. Runs, strike rate, batting average, balls faced and partnerships can all be useful depending on the format and match situation.
What does bowling economy rate mean?
Bowling economy rate shows the average number of runs a bowler concedes per over. It is calculated by dividing runs conceded by overs bowled.
Why is required run rate important?
Required run rate shows how quickly a chasing team needs to score to reach its target within the remaining overs. It changes as the innings develops.
Why should wickets in hand be considered?
Wickets represent remaining batting resources. A team with more wickets available may have more flexibility to attack, while a team with few wickets left may need to manage risk differently.
Can one statistic predict a cricket match?
No. Cricket outcomes depend on many factors, including player performance, conditions, tactics, wickets, scoring rate and unexpected events. Statistics provide context rather than certainty.
How can partnerships help with match analysis?
Partnerships show how two batters combine to build an innings. A sustained partnership can stabilise an innings, increase the scoring rate and change the match situation.
How does an exchange betting ID relate to cricket analytics?
An exchange betting ID is associated with access to an exchange account or service, while cricket analytics describes match and player performance. Analytics can help explain cricket data, but they do not guarantee market outcomes.
What should I check first during a live innings?
Start with the score, wickets, overs, current run rate and required run rate. Then consider the current batters, partnership, bowling figures and remaining resources.
Is cricket analytics useful without betting?
Yes. Cricket analytics can be useful for understanding player development, team strategy, match momentum, commentary, fantasy analysis, coaching and general appreciation of cricket.